MetriCup Guide
Why Your Coffee Shop's Busiest Days Aren't Always Your Most Profitable
 Rich Manalang
Saturday is probably your busiest day. But is it your best day? The answer depends on which numbers you're looking at.
Volume and profitability are not the same thing
A busy Saturday with a line out the door feels like success. But if your team is processing 200 orders of $5 drip coffee, you might be running your highest-labor day for some of your thinnest margins. Meanwhile, a quieter Tuesday with a catering order and a steady lunch rush might generate far more revenue per labor hour with half the chaos.
Most coffee shop owners track total sales. Fewer track how efficiently those sales were generated. That gap is where a lot of money quietly disappears.
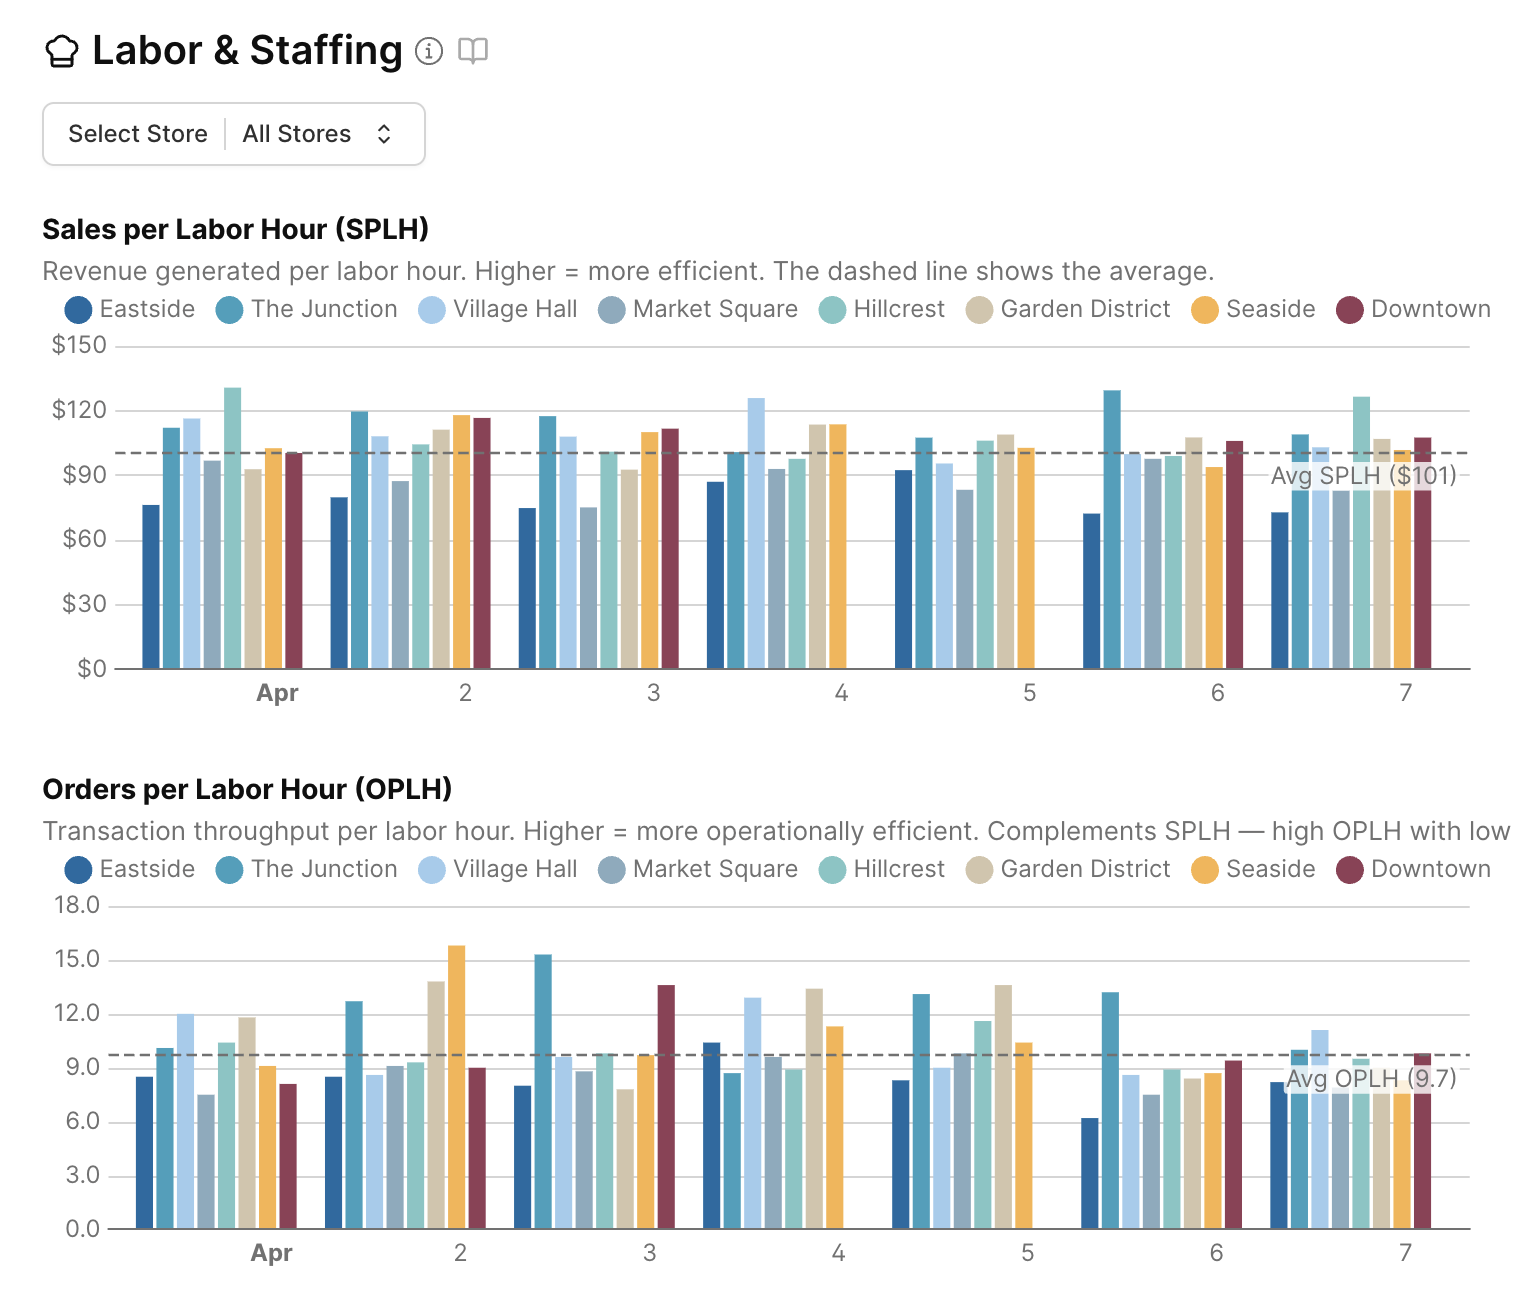
Two metrics that tell the real story
SPLH (Sales Per Labor Hour) measures how much revenue your team generates for every hour worked. It's the gold standard for labor efficiency in food service. A higher SPLH means your team is generating more revenue relative to the cost of staffing.
OPLH (Orders Per Labor Hour) measures throughput — how many transactions your team completes per hour. It separates the question of pace from the question of revenue.
Together they tell you something neither can tell you alone.
What the combinations reveal
High OPLH, low SPLH — lots of small tickets
Your team is moving fast and processing many orders, but each order is small. Think grab-and-go drip coffee, no food, no add-ons. The operation is efficient but the average ticket is dragging revenue down. Consider upsell training, menu positioning, or pairing suggestions.
High SPLH, low OPLH — fewer but bigger transactions
Revenue per hour is strong even though transaction count is lower. This often means catering orders, wholesale accounts, or a premium customer base that orders espresso drinks with food. Not a problem — but understand what's driving it, because it can also mean slow foot traffic masked by high ticket sizes.
High OPLH, high SPLH — your best days
Strong transaction volume and strong revenue per transaction. Your team is efficient and customers are spending well. Study these days — what was the weather, the day of week, the staffing level? Try to replicate the conditions.
Low OPLH, low SPLH — your worst days
Slow traffic and small orders. These days almost always mean you were overstaffed for demand. The fix is better scheduling — fewer people on slow shifts, not cutting corners on busy ones.
The throughput ceiling problem
There's another pattern worth knowing: when OPLH climbs very high, tip percentage tends to drop. Your team is processing orders faster than the experience can support — drinks are rushed, names are skipped, the line feels like a conveyor belt. Customers notice, and they tip less.
This is the throughput ceiling. Every store has one — the point above which going faster starts hurting the experience. If you can find yours, you know exactly when adding a person to the floor pays for itself in customer satisfaction.
How to start using this
Pull your sales data from Square and your labor hours from your scheduling system. Calculate SPLH and OPLH for each day over the last 30 days. Sort by SPLH, not by total sales. The ranking will surprise you.
Your "best" days probably aren't Saturdays. They're the mid-week days where demand was steady, the team was right-sized, and customers came in to linger. Those are the days worth engineering more of.
MetriCup
See SPLH and OPLH for every store, every day
MetriCup connects your Square POS and labor data to show you exactly which days are generating the most revenue per hour — and which ones look busy but aren't.
Get early access