MetriCup
Your coffee shop data,
finally making sense.
MetriCup connects Square POS, labor timesheets, loyalty, and online channels into one dashboard — so you can run your shop on numbers, not guesswork.
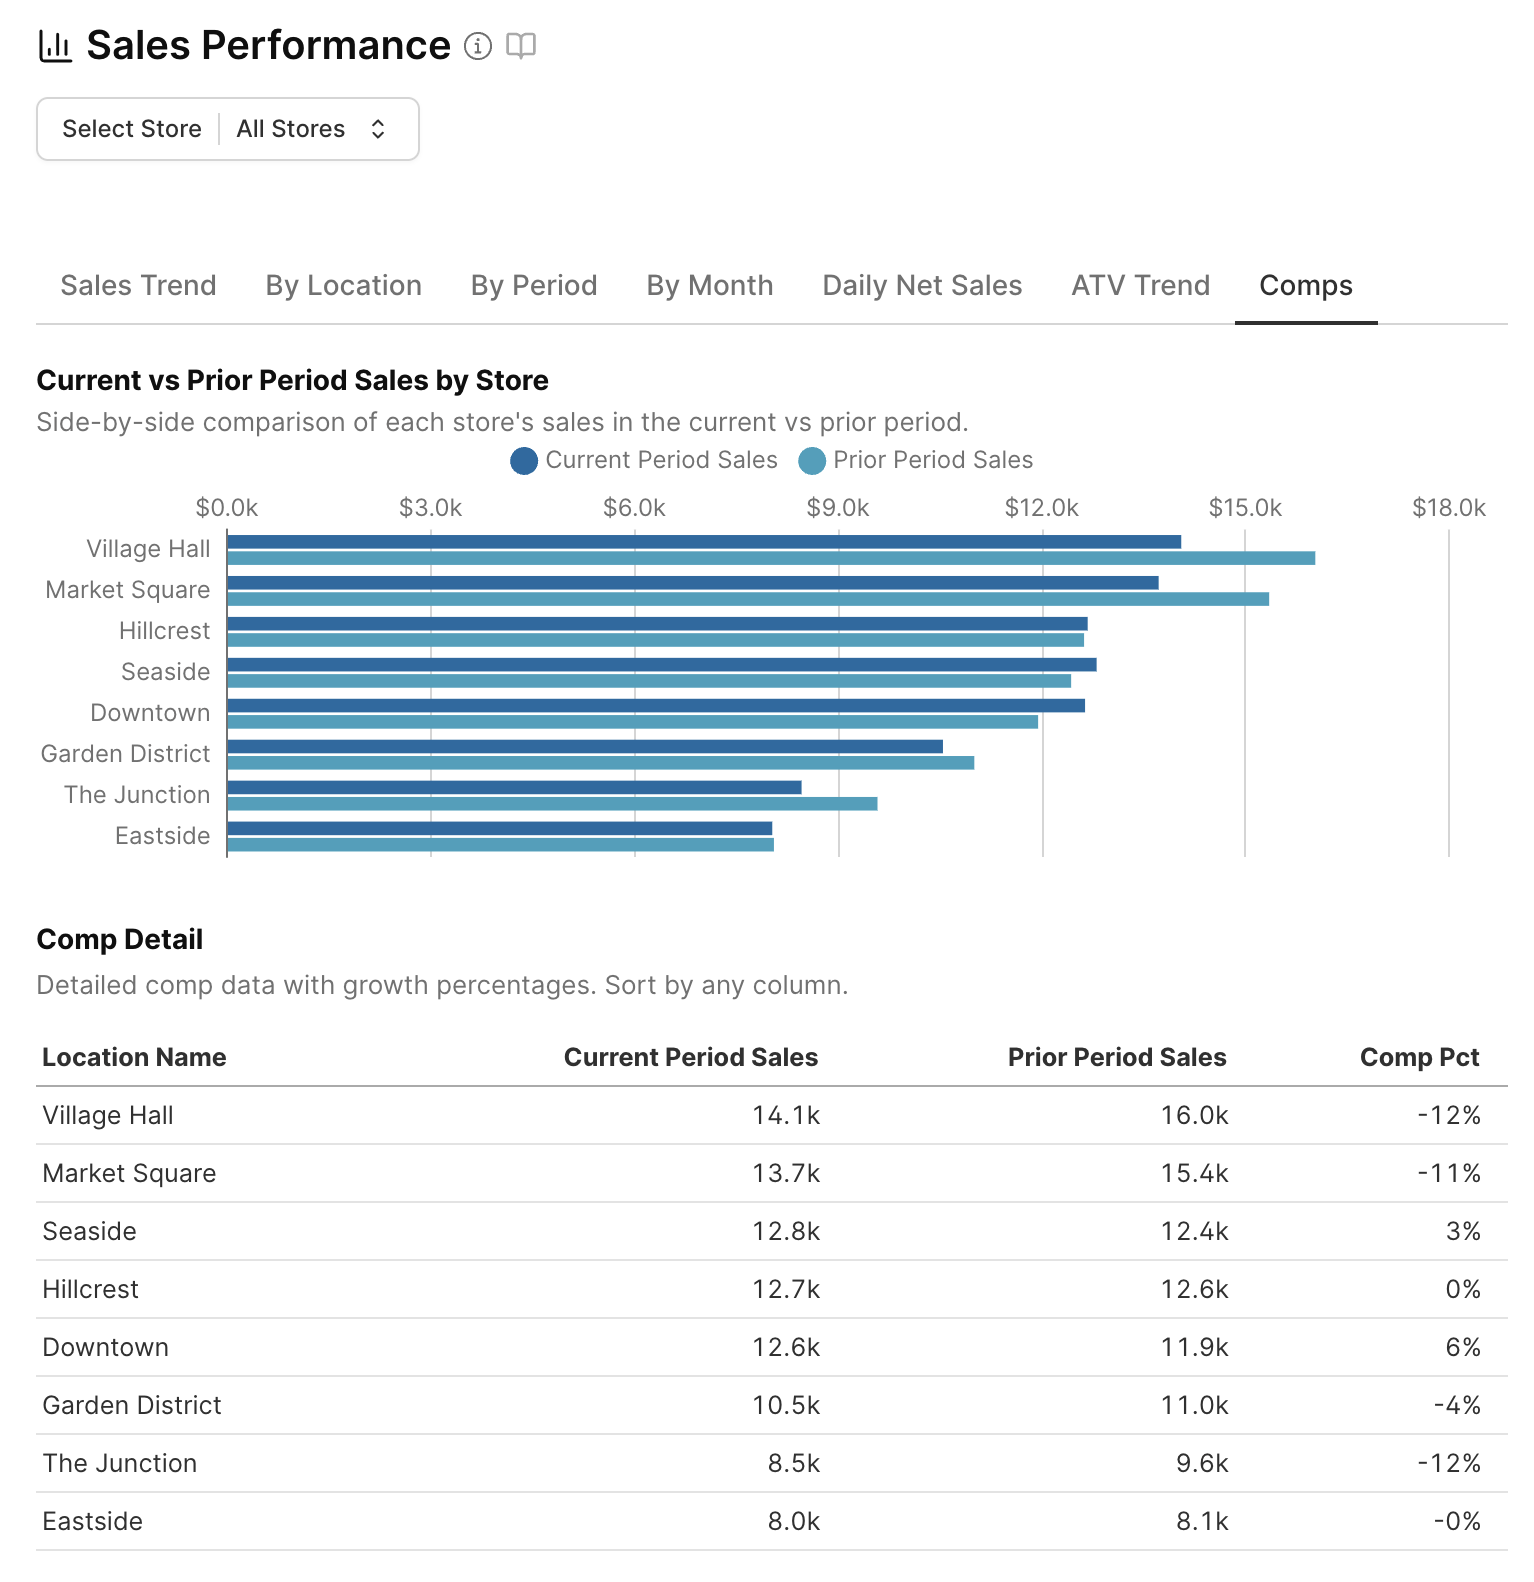
A real MetriCup dashboard — multi-location specialty coffee data
What MetriCup Surfaces
The data your POS doesn't show you
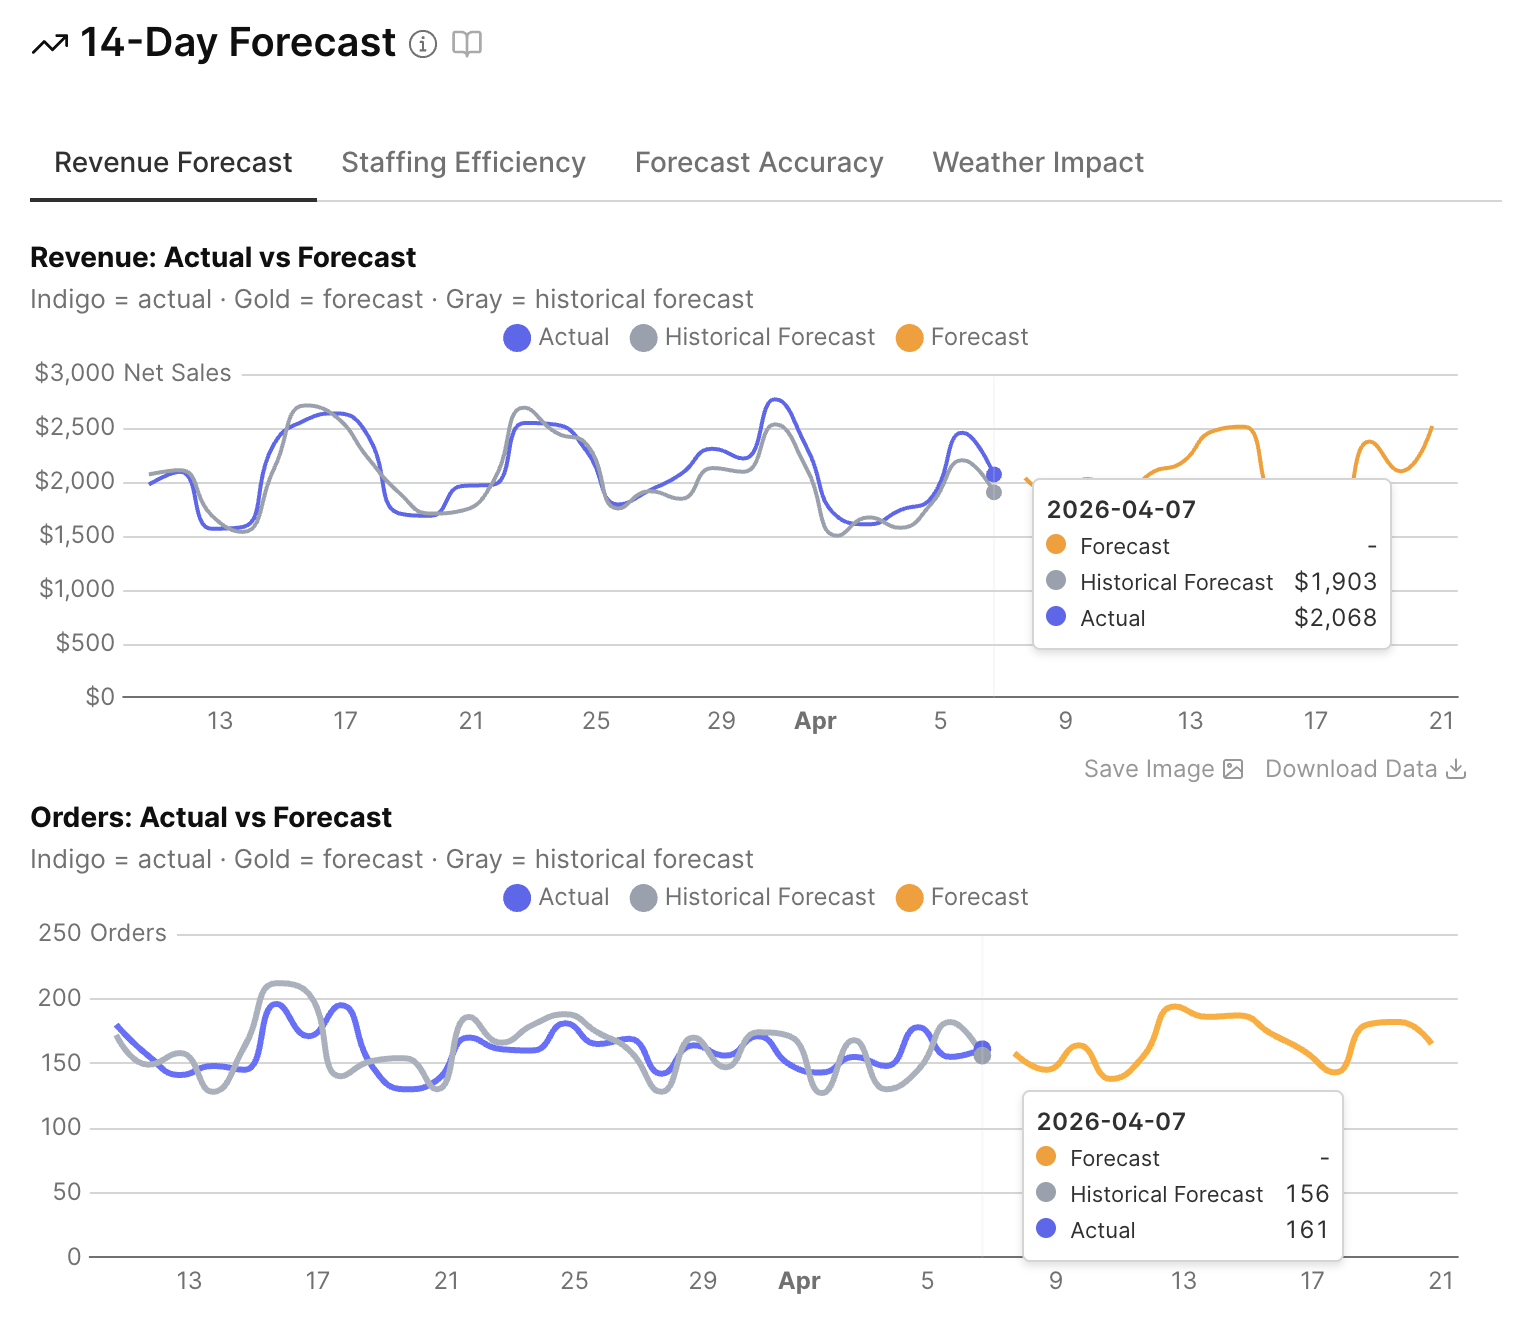
Plan the next 14 days: revenue, staffing, and efficiency — per location
MetriCup forecasts daily revenue and order volume for the next two weeks using a three-layer model: a same-day-of-week baseline, per-location holiday adjustments, and weather-based corrections. That forecast drives recommended staffing hours — so managers schedule to demand, not habit. Then the loop closes: see how accurately each location was staffed and refine from there.
- →Baseline from median of last 4 same-day-of-week sales — holiday periods excluded automatically
- →Per-location holiday factors — Downtown loses 81% on Presidents Day, Market Square gains 34%
- →Weather sensitivity calibrated per store — walk-up locations and indoor cafés respond very differently
- →Recommended staffing hours built directly from forecasted demand, not last cycle's schedule
- →Staffing accuracy score: how closely scheduled hours matched actual demand — post-shift, per location
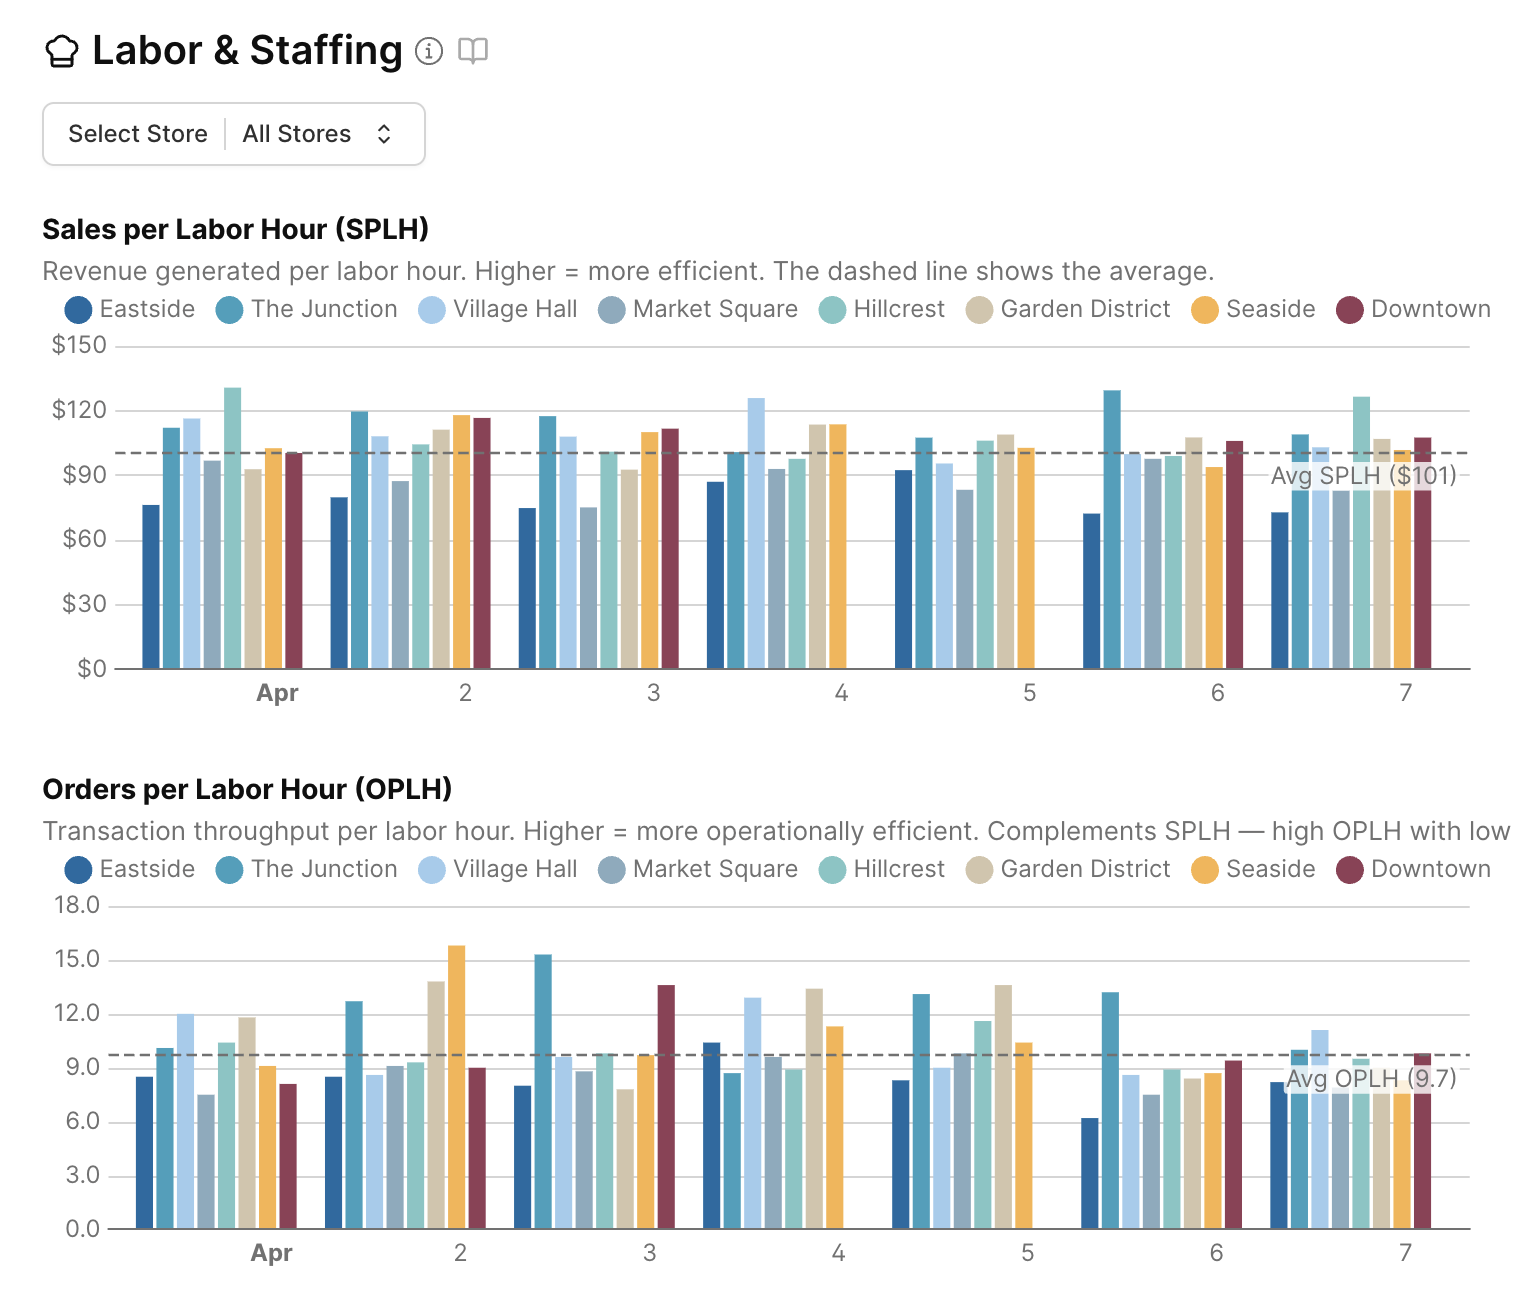
Labor efficiency you can actually act on
Beverage-focused cafés typically target $80–120 in sales per labor hour — though the right number depends on your model. A full-service shop with a kitchen and wait staff will run lower. MetriCup shows your SPLH and OPLH by store and by day so you can benchmark against yourself, not a generic industry average.
- →SPLH (Sales Per Labor Hour) — the gold standard for labor efficiency
- →OPLH (Orders Per Labor Hour) — throughput vs. ticket size, separated
- →Staffing accuracy score: how closely scheduled hours match demand
- →OPLH vs. Tip % scatter — see where throughput starts hurting satisfaction
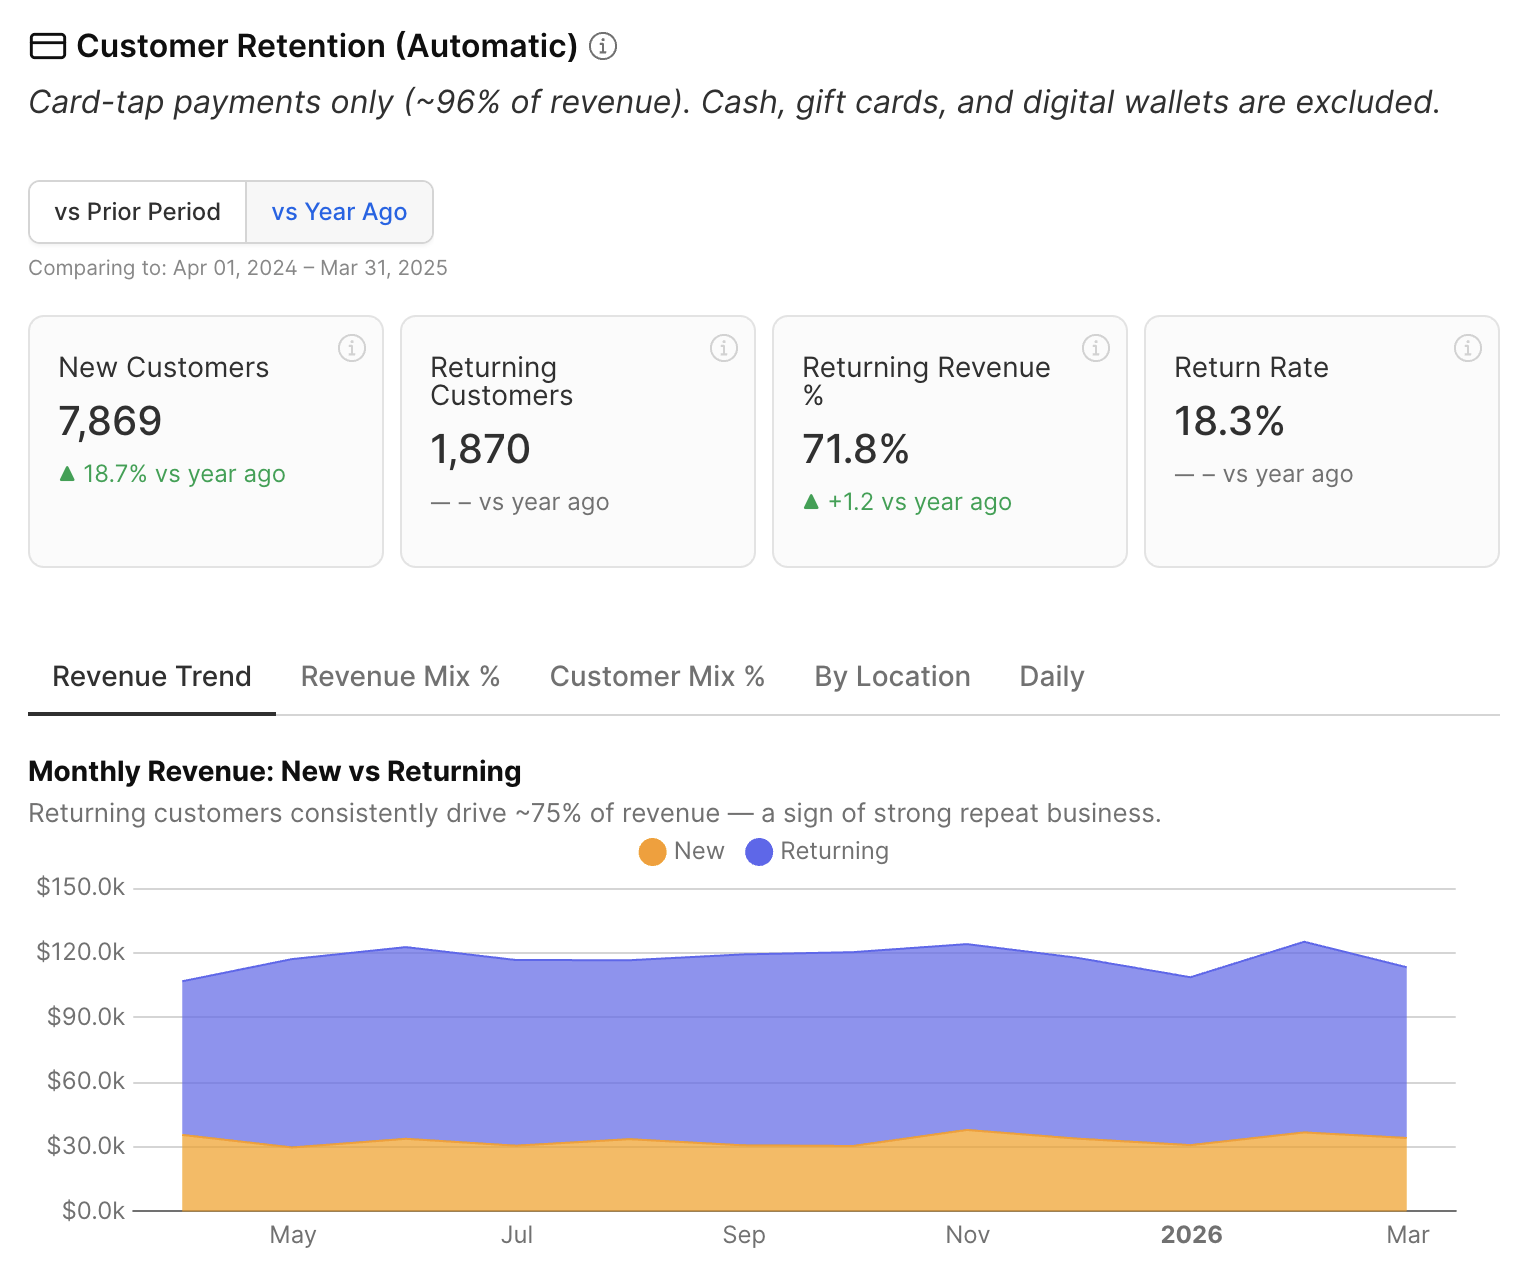
Customer retention without a loyalty app
MetriCup uses card fingerprinting to classify every card-tap transaction — ~96% of revenue — as New or Returning, with no checkout friction required. You'll finally know whether growth is coming from acquisition or retention.
- →New vs. Returning customer split across all locations (~96% of card-tap revenue tracked automatically)
- →Average ticket (AOV) and customer lifetime value (CLV)
- →Loyalty program penetration: % of transactions from known customers
- →Monthly acquisition and cumulative loyalty customer growth
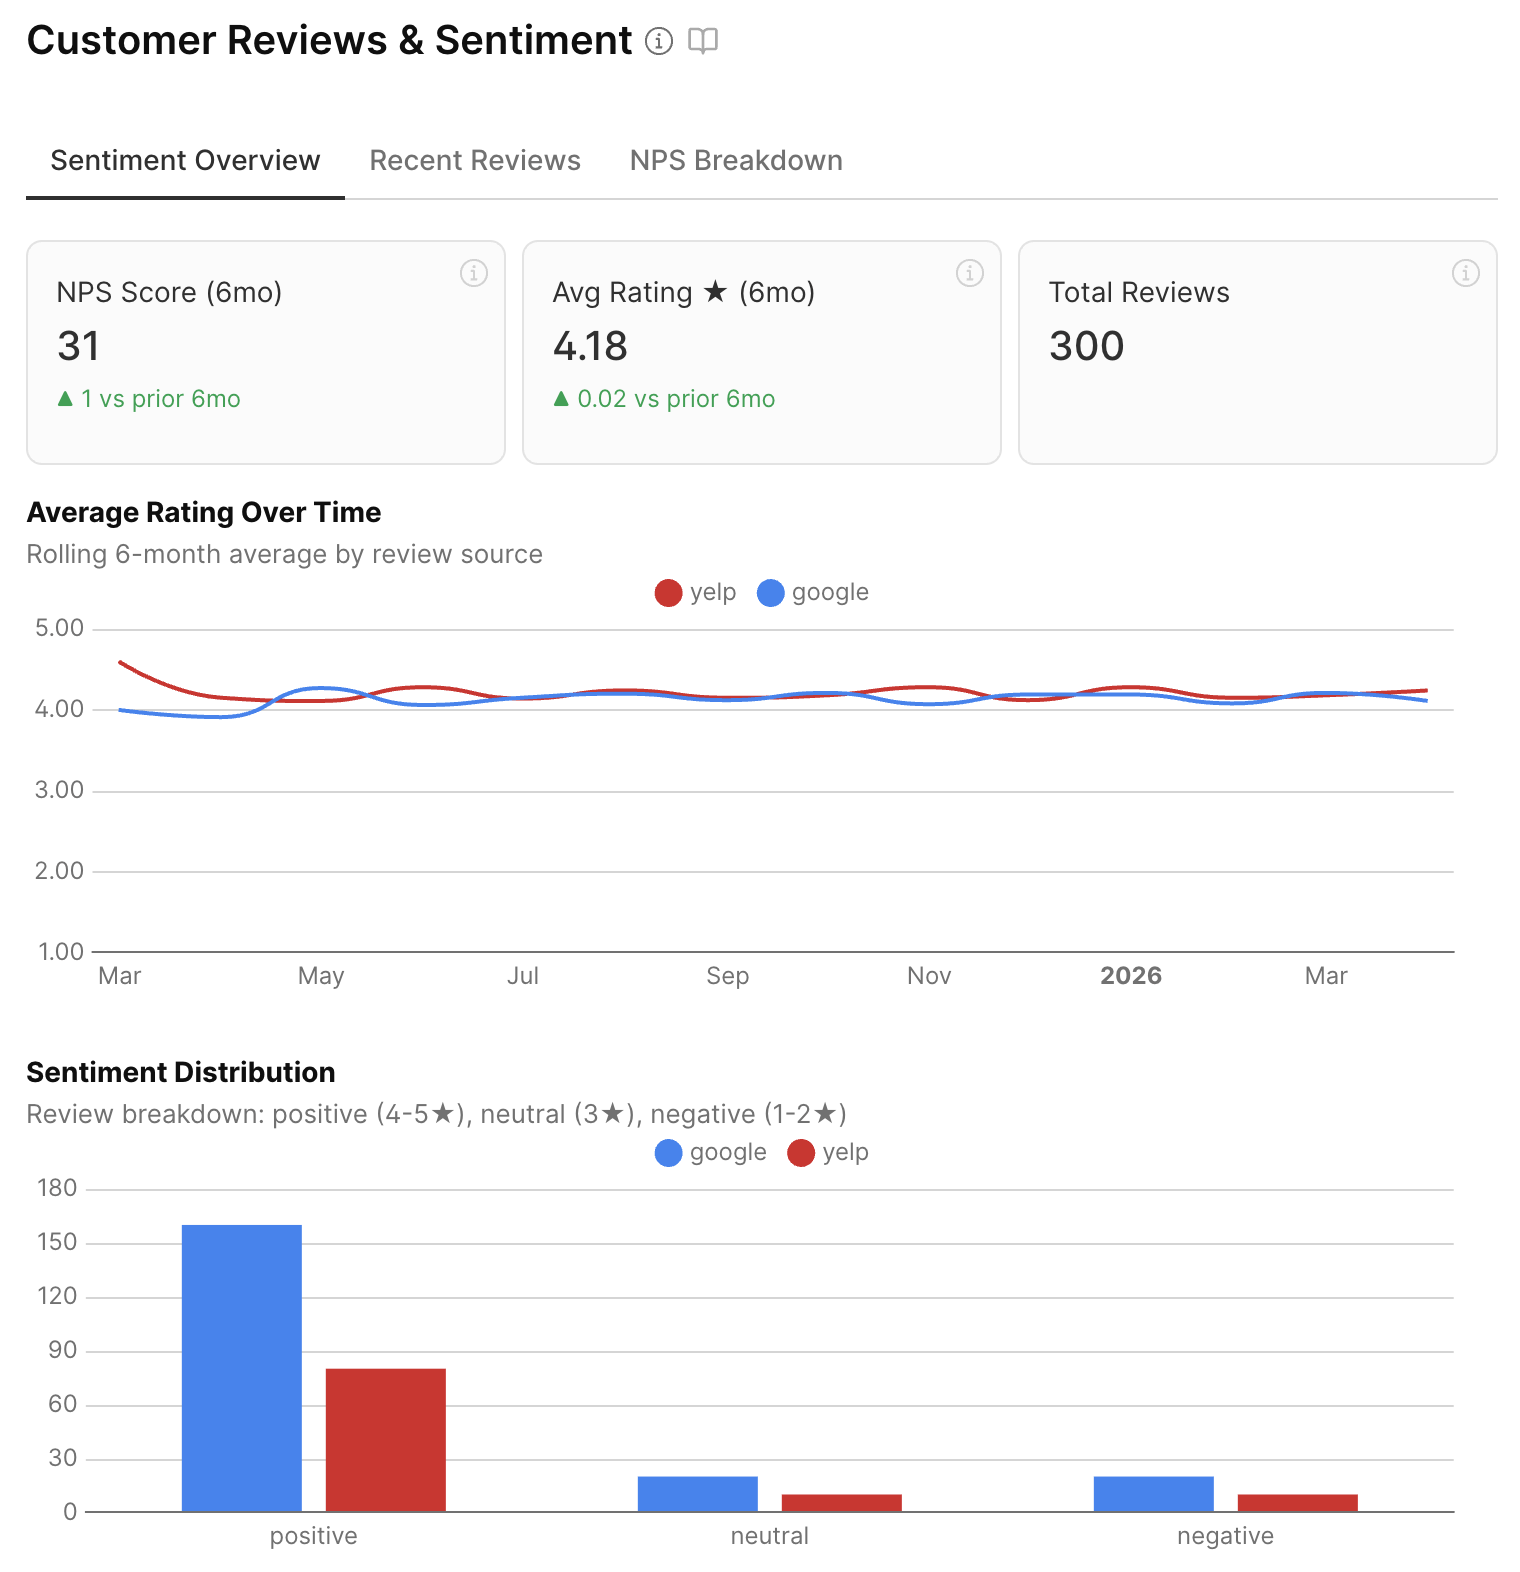
Customer satisfaction, connected to your operations
MetriCup pulls your Google and Yelp reviews into the same dashboard as your SPLH and staffing data — so you can see whether efficiency improvements are helping or hurting the customer experience.
- →NPS score and average star rating (Google + Yelp) over time
- →Sentiment distribution: positive, neutral, and negative review breakdown
- →NPS vs. SPLH scatter — does running lean hurt your reviews?
- →Rolling 6-month trend so short-term noise doesn't distort the picture
Sales intelligence across every location
See net sales, transaction volume, same-store comps, and revenue by channel — all in one view. Compare locations side by side, spot which stores are growing, and drill into the days where something went wrong.
- →Same-store comps (the industry-standard multi-unit metric)
- →Revenue breakdown by POS, Square Online, Craver, and DoorDash
- →Period-over-period and year-over-year comparisons
- →Tipping by channel — DoorDash tips average 0.4%, in-store averages 12%
Ready to see your data?
MetriCup is in early access. Drop your info and I'll reach out to get your shop connected.
Get early access