MetriCup Guide
Same-Store Sales: The Metric Every Multi-Location Coffee Shop Owner Should Track
 Rich Manalang
Opening a second location feels like growth. But is your first location still growing? Same-store comps are the only way to know.
The problem with total revenue as a growth metric
When you open a second location, your total revenue goes up. That feels good. But it masks what's actually happening at your original store. If location one is quietly declining while location two is growing, your combined revenue might look fine — right up until the original store is in serious trouble.
This is exactly why the restaurant and retail industry invented same-store sales, also called comps or comparable store sales. It strips out the effect of new openings and shows you organic growth — or decline — at each individual location.
How same-store comps work
The calculation is simple: take each store's revenue for the current period and compare it to the same period last year (or the prior equivalent period). Express the difference as a percentage.
Formula
Comp % = (Current Period Sales − Prior Period Sales) ÷ Prior Period Sales × 100
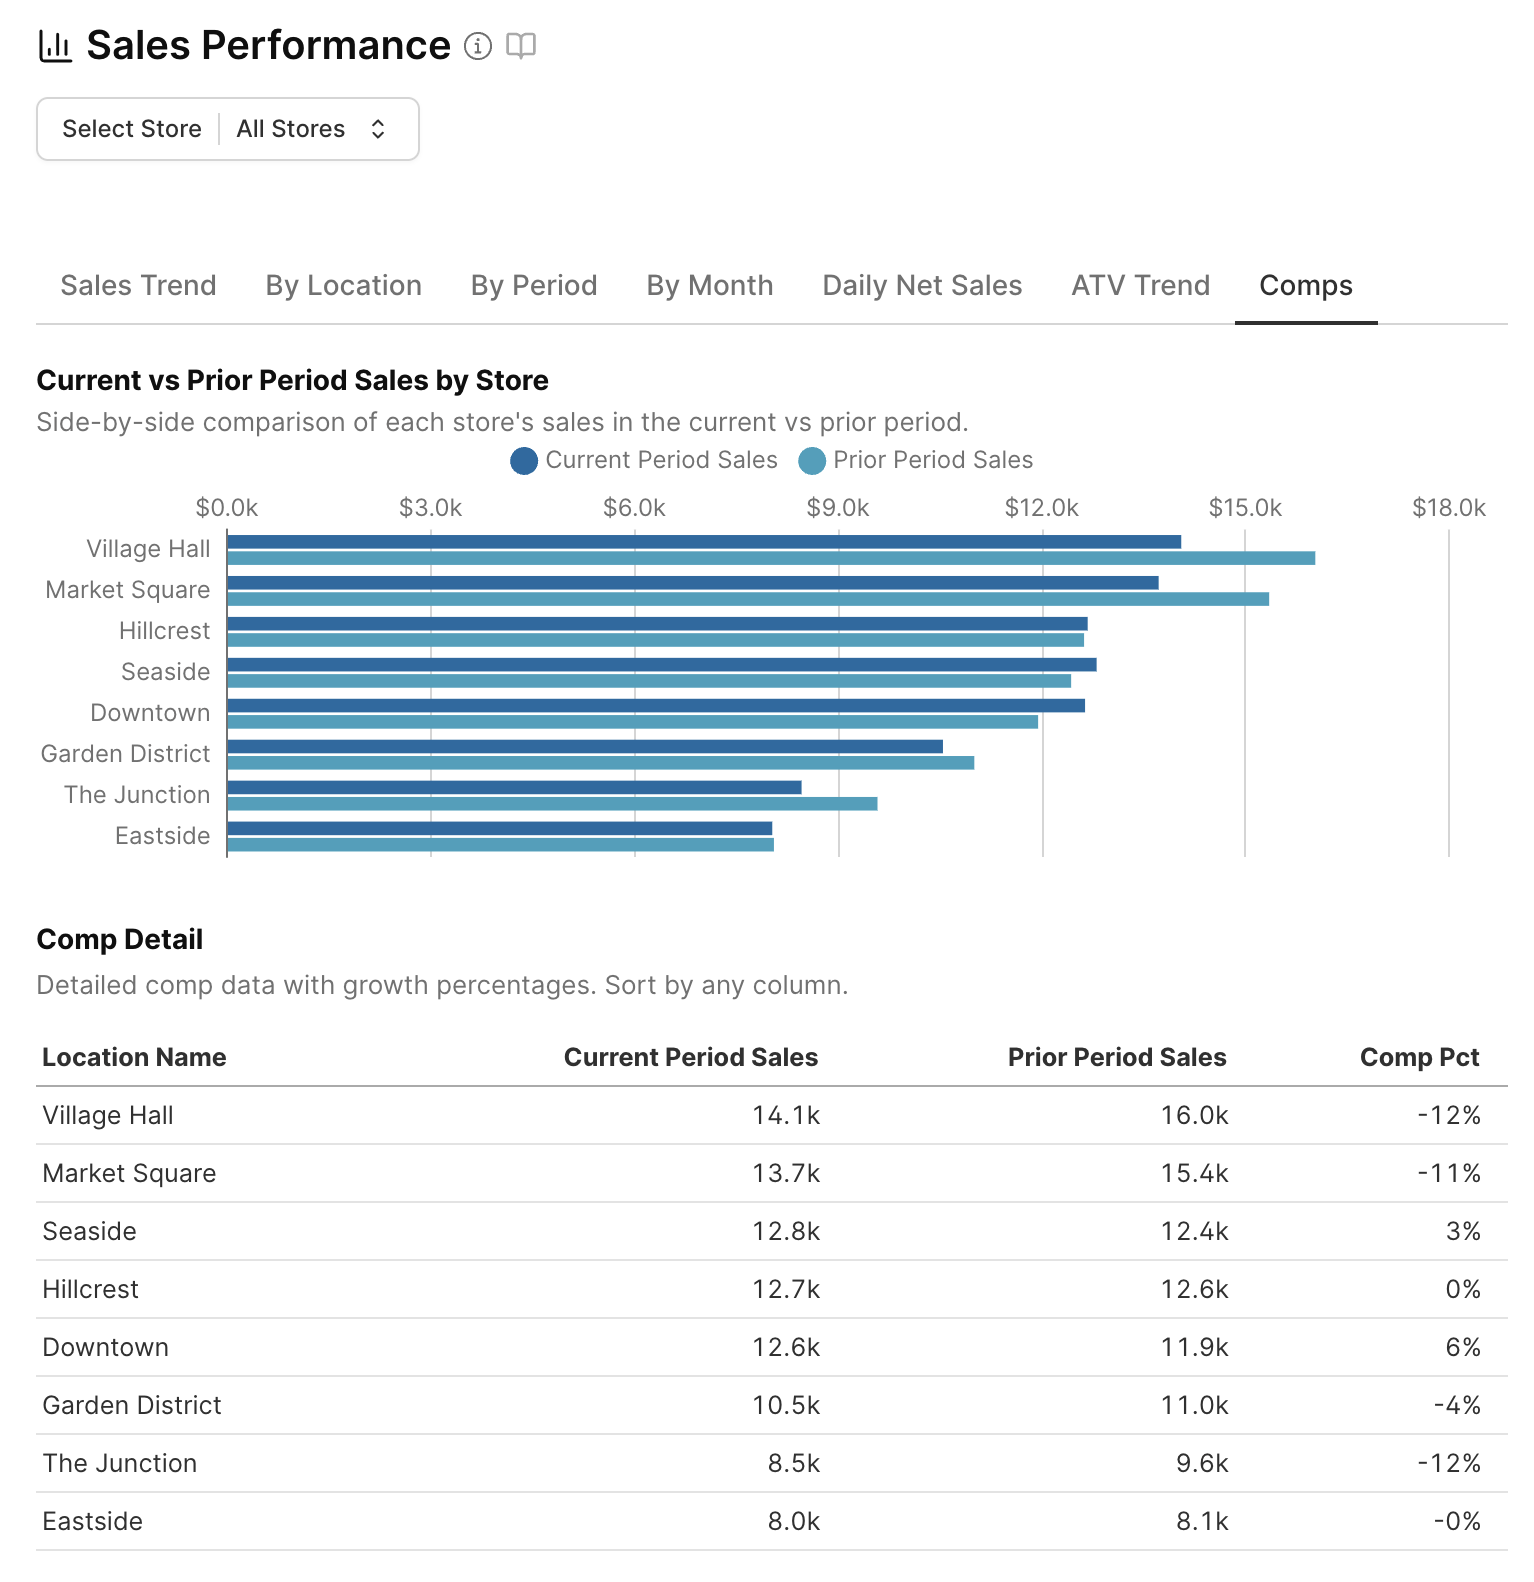
Example: $14,100 this month vs $16,000 last year = −12% comp
A positive comp means the store is growing on its own merits. A negative comp means it's declining — even if total company revenue is up because you added locations.
What comps tell you that total revenue doesn't
One location is declining while others grow
This is a location-specific problem. Explore whether staffing, product mix, local competition, or neighborhood dynamics have shifted. A single negative comp doesn't warrant panic — a consistent trend over three or more periods does.
All stores are declining together
Likely a macro or seasonal factor — weather, local economy, a pricing change, or a product that fell out of favor. Since it affects all locations, the problem is probably systemic rather than location-specific.
One location is significantly outperforming
Worth understanding what's working there. Is it a manager, a local marketing push, a product mix change, or a demographic shift in the neighborhood? Successful patterns at one store can often transfer to others.
Period-over-period vs year-over-year
There are two useful comp comparisons, and they answer different questions.
Period-over-period (e.g., this month vs last month) shows short-term momentum. It catches problems early but can be noisy — a bad weather week can make a healthy store look like it's declining.
Year-over-year (e.g., this April vs last April) controls for seasonality. It's slower to signal problems but more meaningful when it does. A store that's down 10% year-over-year for three consecutive months has a real issue.
Track both. Use period-over-period for operational awareness, year-over-year for strategic decisions.
When to start worrying
A single negative comp is noise. Two consecutive negative comps is a signal worth investigating. Three or more is a trend that requires a response — whether that's a management change, a menu refresh, a local marketing push, or a harder conversation about the location's long-term viability.
The earlier you catch a declining comp, the more options you have to fix it. Waiting until total revenue is noticeably down means you've already lost months of runway.
MetriCup
Comps calculated automatically across all your locations
MetriCup pulls your Square data and calculates same-store comps for every location — period-over-period and year-over-year — without any manual spreadsheet work.
Get early access